A Visualization-Oriented Time Series Data Aggregation
Why send a million rows to a line chart that is 1000 pixels wide?
PVLDB 7(10), 2014 · Selected Among the Best Papers of VLDB 2014
Uwe Jugel, Zbigniew Jerzak, Gregor Hackenbroich (SAP AG) · Volker Markl (TU Berlin)
The Problem
Big Sensor Data Meets Small Screens
432Mrows for 100 engineers watching 12h of 100Hz sensor data
26GBtransferred from the database to the visualization clients
260MBloaded per user before a single chart appears
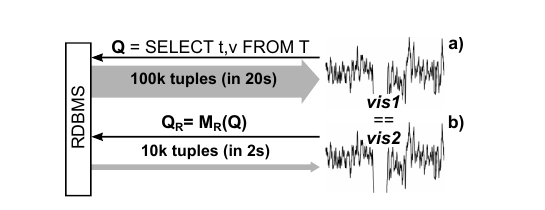
Visual analytics tools issue queries against the RDBMS and read the raw result — millions of rows for one chart.
The Insight
Rewrite the Query, Not the Client
Rewriting Q to a data reduction query M_R(Q): 100k tuples in 20s become 10k tuples in 2s — and the two visualizations are identical.
The final chart is a width × height pixel raster. That reduction happens anyway — M4 pushes it into the database, at the query level.
The M4 Aggregation
Four Tuples per Pixel Column
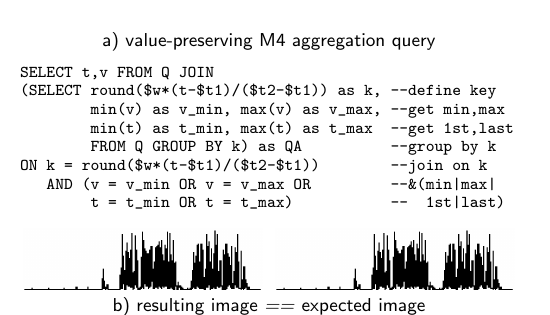
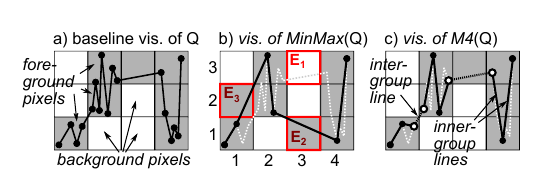
Group the series into w equidistant time spans — one per pixel column — and keep only the tuples with min(v), max(v), min(t), and max(t): hence M4.
4·wupper bound of tuples for an error-free two-color line chart
O(n)aggregation complexity — one pass, plus a bounded hash-join
0pixel errors, proven — not approximated
The Query
Plain SQL on Any RDBMS
The M4 query: value-preserving aggregation and re-join, expressed in standard SQL — resulting image equals the expected image.
Why Not MinMax or Averaging?
Rasterization Semantics Matter
MinMax misses the first and last tuples per pixel column, causing missing and false lines between columns.
Averaging (PAA) reshapes the series; sampling misses extrema; MinMax draws false inter-column lines. Only the four extrema per column preserve every foreground pixel.
Pixel Errors, Measured
40k Tuples on a 100×20 Canvas
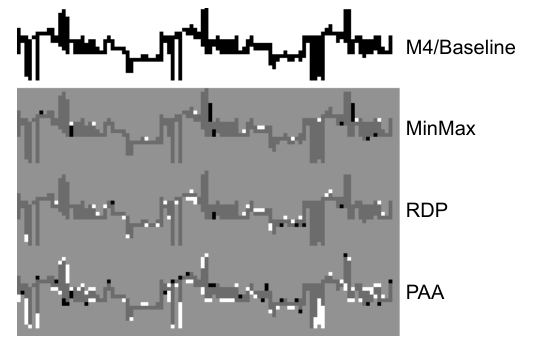
M4 matches the baseline exactly; MinMax produces 30 false pixels, RDP 39, and averaging (PAA) over 100.
Line simplification (RDP, Visvalingam) optimizes geometric distance — not the pixels the reader actually sees.
Performance
One Order of Magnitude Faster
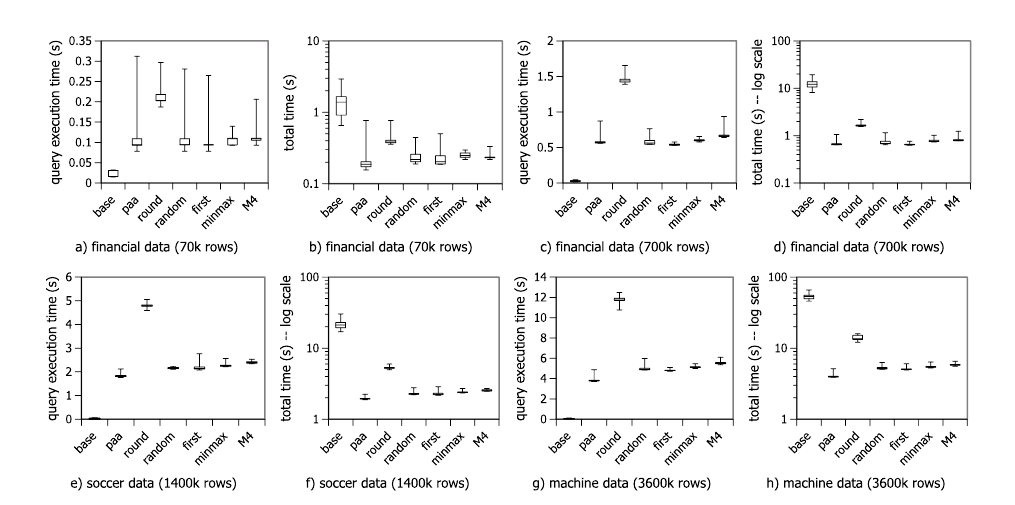
Query execution and total times for financial, soccer, and machine data on SAP HANA — aggregation-based reduction wins across all data sets.
In-Database Reduction
The Architecture That Wins Twice
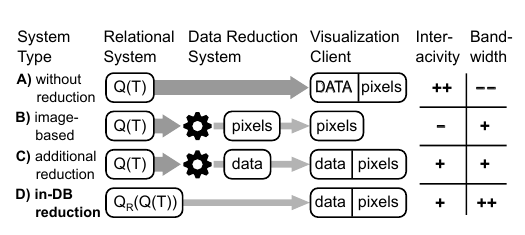
System types compared: in-DB reduction keeps interactivity high and bandwidth low.
Data Reduction 1 : 500
The motivating scenario shrinks from 463 million to 800,000 tuples — every user still gets a pixel-perfect chart.
Transparent to Clients
The rewritten query returns the original schema. No client changes, no plugins — any RDBMS, any charting stack.